Introduction
For correct morphological diagnosis of anemia histogram plays an important role.
Amongst various indices, MCV and RDW were important for interpretation of morphology.1, 2
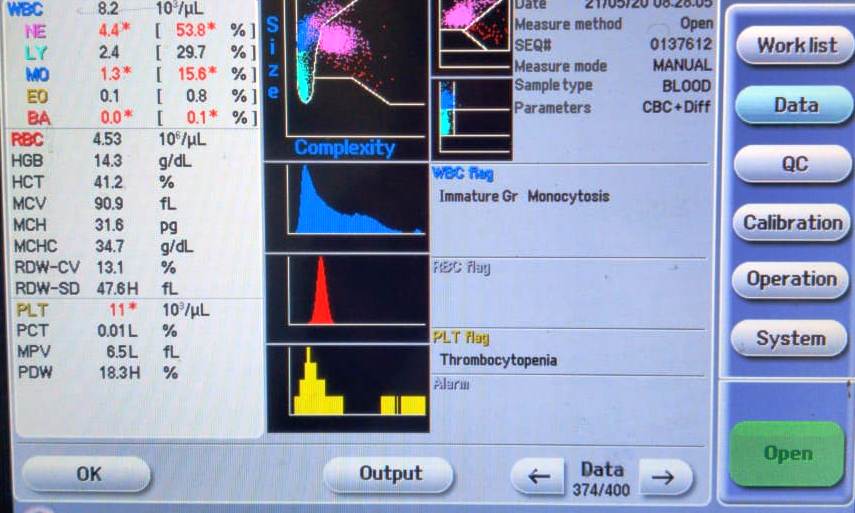
The curve of Red cell distribution is bell shaped and peaks within 80 to 100 fl.
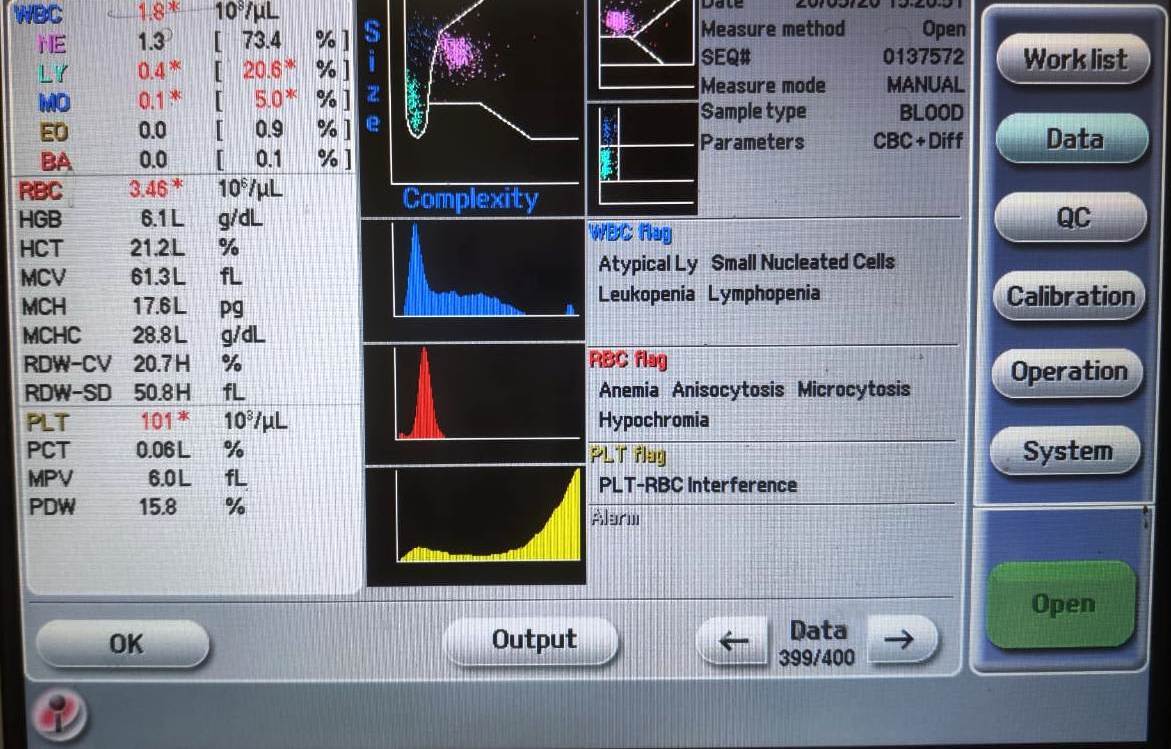
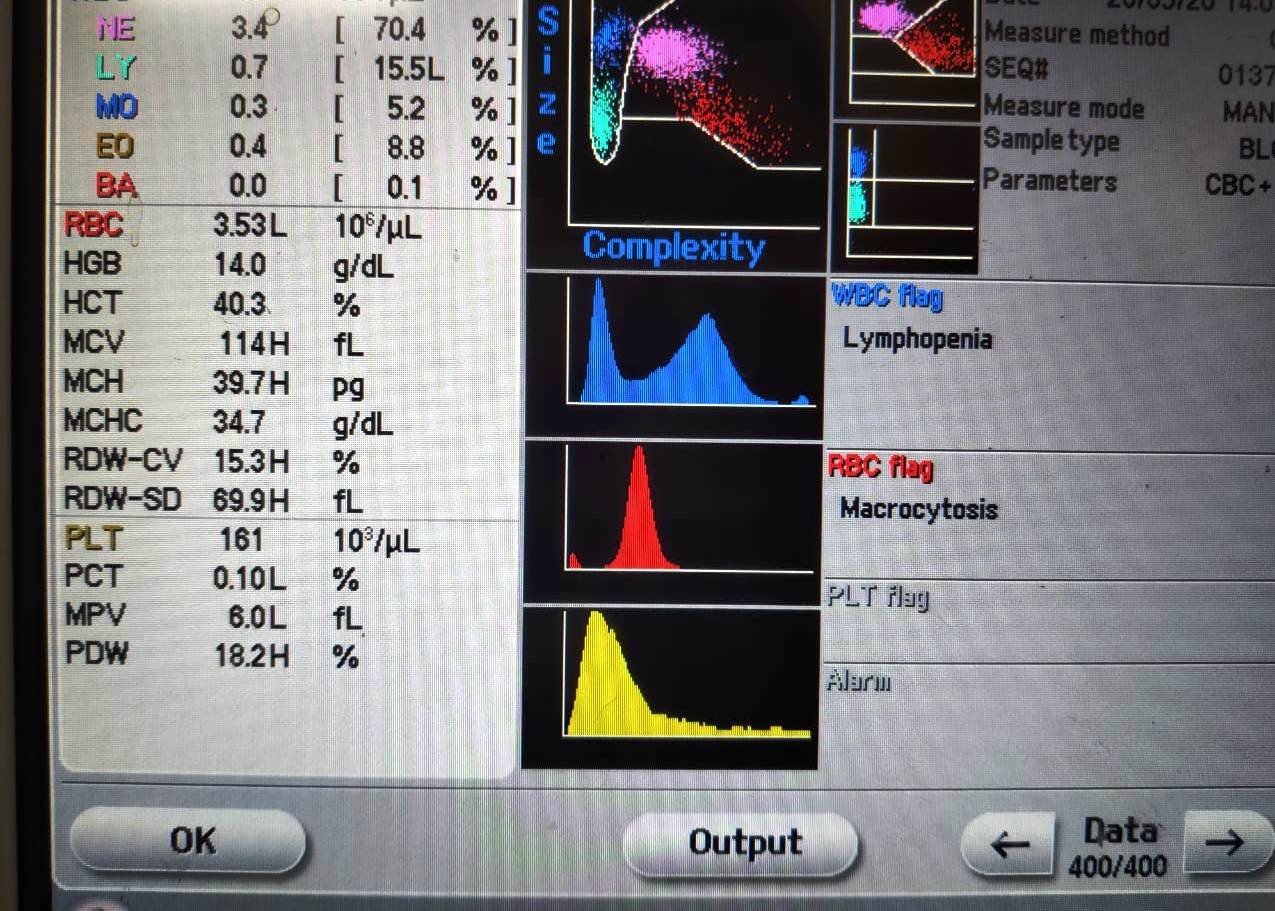
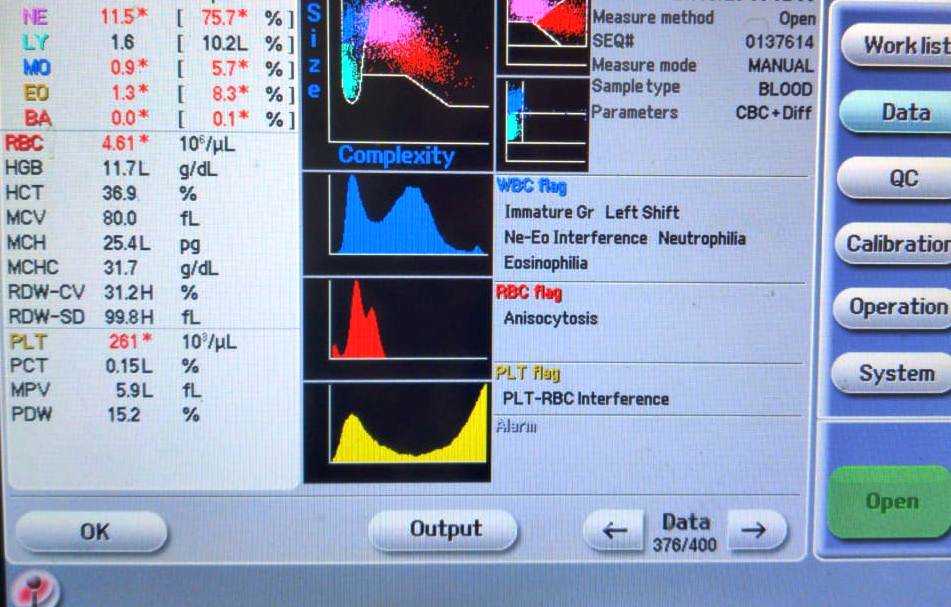
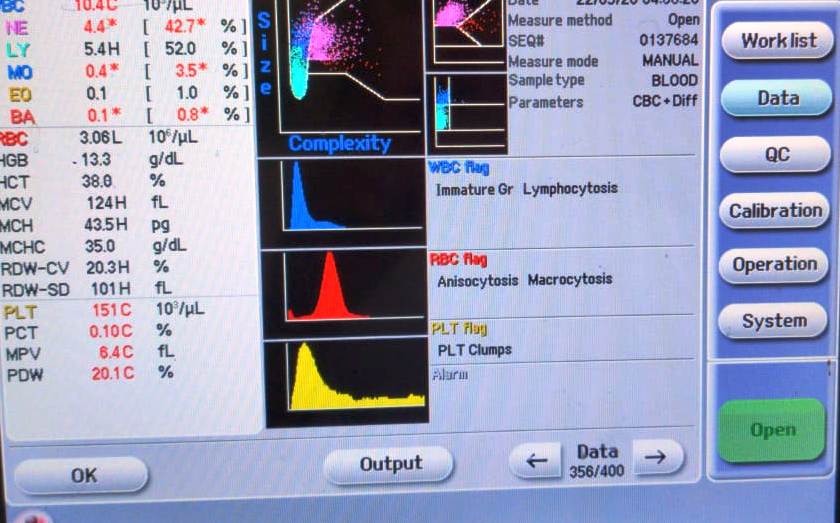
For homogenous population of cells the curve was smaller, while for heterogenous population the curve was wider. The curve was shifted to right in megaloblastic anemia due to macrocytes ;while in microcytic anemia it was shifted to left.
If the patient had received treatment, Morphologically two red cell population was seen, in which multiple peaks can be observed and is referred to as Dimporhic anemia. In these conditions RDW was the better indicator than MCV to assess anisocytosis.3, 4
Higher RDW represents dual population of cells like small cells, some normal size cells, and immature red cells which were larger than normal.5
Materials and Methods
Patients were studied during this period
The Red blood cell histograms of all anemic patients visiting the haematology section were analyzed and tried to find a correlation between histogram and peripheral smear findings.
Complete blood count were obtained by Nihon Kohden 5 part automated haematology analyser along with histogram. Peripheral smear examination was also done.
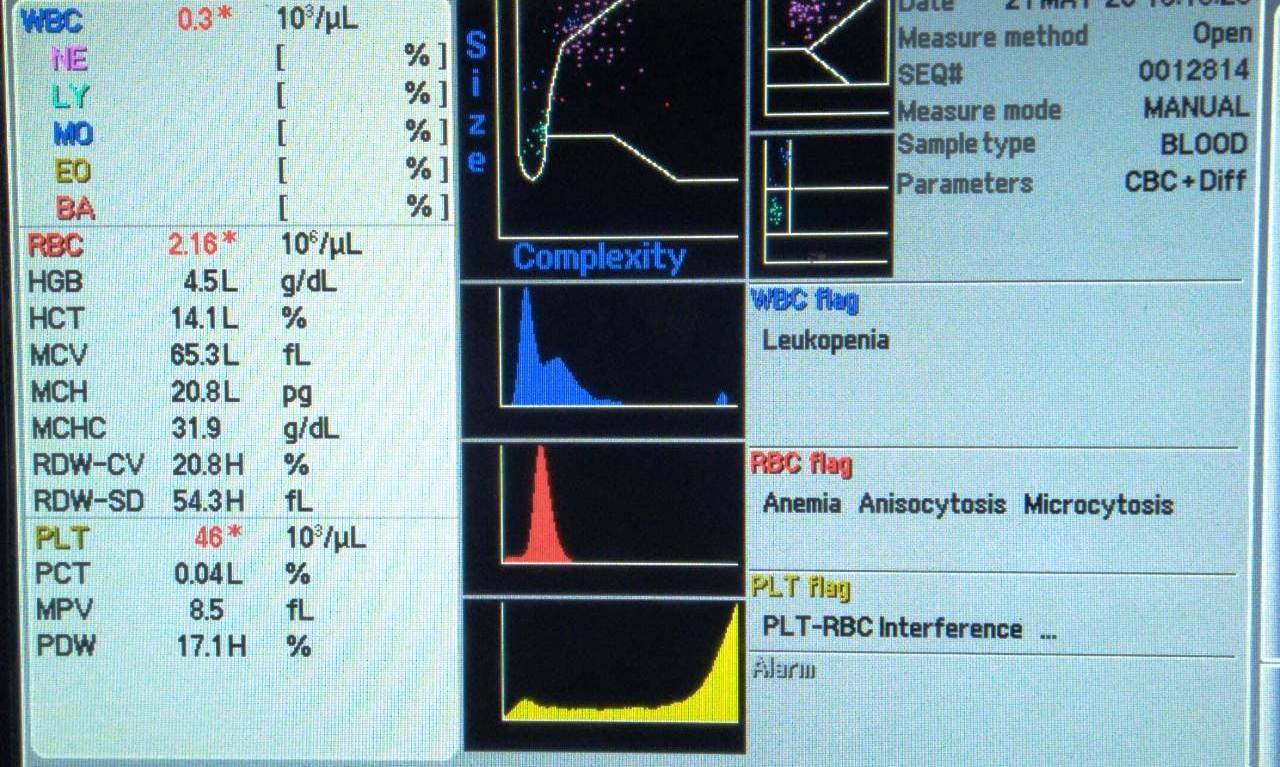
In microcytosis, the RBC graph started before 34 fl and again reached to baseline before 150 fl and referred as shift to left.
While in macrocytosis there was right shift where the graph started after 34 fl and reached to baseline after 150 fl.
Graph started at 34 fl and ending between 225-250 fl were considered to be a broad base.
In dimorphic anemia the RBC graph showed 2 peaks due to presence of dimorphic cells.
If the RBCs population had single lineage of cells, the graph would be constraint and gave a short peak.
Data was analysed using SPSS 22 and P-value was calculated using chi-square & degree of freedom. P value of 0.05 or less was considered statistically significant.
Results
In our study of histograms of various types of anemia total 176 cases were studied.
This study included predominantly 130 (73.86%) females and 46 (26.17%) males.
Maximum number of anemia cases were noted in 30-40 years of age range (Table 1).
Table 1
Age and sex wise distribution of anemia
|
Age in yrs |
10- 20 |
21- 30 |
31 -40 |
41 -50 |
51- 60 |
Total |
|
Total |
07 |
39 |
82 |
32 |
16 |
176 |
|
% |
3.97 |
22.15 |
46.59 |
18.18 |
9.19 |
100 |
|
Male |
03 |
15 |
19 |
14 |
05 |
46 |
|
Female |
04 |
24 |
63 |
18 |
09 |
130 |
|
M : F |
|
|
|
|
|
|
All cases had hemoglobin less than 11 gm/dl.
Cases were consisted of Normocytic normochromic anemia, Microcytic hypochromic anemia, dimorphic anemia and pancytopenia which were diagnosed by peripheral smear.
In our study 34 (19.31%) cases were normocytic normochromic anemia, 114 (64.77%) cases were of microcytic hypochromic anemia, 5 (2.84%) cases were of macrocytic anemia and 21(11.93%) cases were of dimorphic anemia. Pancytopenia was seen in 02 (1.13%) cases (Table 2).
Table 2
Cases in different anemias
|
Types of anemia |
No.of cases |
Percentage (%) |
|
Hypochromic Microcytic Anemia |
114 |
64.77 |
|
Normochromic Normocytic |
34 |
19.31 |
|
Macrocytic |
05 |
2.84 |
|
Dimorphic |
21 |
11.93 |
|
Pancytopenia |
02 |
1.13 |
|
Total |
176 |
100 |
In our study of 176 cases, 28(15.907%) cases showed normal curve, left shift were seen in 52(29.54%) cases, right shift in 09 (5.11%) cases, broad base in 68 (38.63) cases, short peak in 07 (3.97%) cases and bimodal curve in 12(6.82%) cases (Table 3).
Table 3
Types of histogram abnormality
|
Types of histogram |
No. of cases |
Percentage |
|
Normal Curve |
28 |
15.90 |
|
Left shift |
52 |
29.54 |
|
Right Shift |
09 |
5.11 |
|
Broad Base |
68 |
38.63 |
|
Bimodal |
12 |
6.82 |
|
Short peak |
07 |
3.97 |
In Normochromic Normocytic anemia MCV, MCH, MCHC and RDW were within normal limits.
MCV, MCH were decreased in Hypochromic Microcytic anemia with increased RDW and increased MCV, MCH, RDW with normal MCHC was seen in Macrocytic anemia.
MCV, MCH, MCHC were within normal limits and RDW was increased due to high degree of ansiopoikilocytosis in Dimorphic anemia.
In pancytopenia only change noticed in red cell indices are increased RDW with normal MCV, MCH, and MCHC.
In our study out of 34(19.31%) cases of Normocytic Normochromic anemia, 21(11.93%) cases showed normal curve and 13(7.38) % showed broad base curve.
Out of 114(64.77%) cases of microcytic hypochromic anemia 4(2.27%) cases were normal, 59 (33.52%) cases showed shift to left, 44 (25%) cases showed broad base curve, 4 (2.27%) cases showed bimodal curve and 3 (1.71%) cases showed short peak. Out of total 21 (11.93%) cases of Dimorphic anemia, 2(1.13%) cases showed normal curve,1 (0.56%) case showed left curve, 7 (3.97%) cases showed right curve, 2 (1.13%) cases showed broad base curve and 9 (5.11%) cases showed bimodal curve. All 5 (2.84%) cases of macrocytic anemia showed right shift curve. All pancytopenia cases were broad base curve (Table 4). P value of <0.001 and chi square value 70.14 were considered statistically significant (Table 4).
Table 4
RBC histogram variations in different anemia
Table 5
Comparative study of anemia based on peripheral smear
Table 6
Comparative study of histogram curves
Discussion
The RBC histogram was generated in automated haematology analyser depending upon the particle size.
Information about RBC parameters like RDW, MCH and MCV.1, 2 were obtained which helped in diagnosis and typing of anemia.
Normal curve was symmetrical bell shaped or showed Gaussian distribution. Normal curve shows MCV range between 80-100 fl.6, 7, 8
RBC histogram in the cell counter counts only those cells as RBCs who have volume sizes between 36 fl to 360 fl.
Those cells counted in the range 24 fl to 36 fl were rejected and not included in the RBC count.
If the RBC graph started below 36 fl it was due to presence of small particles like microspherocytes, malaria parasite, platelet clumps, normoblast, elliptocytes, bacteria, etc.9
The coulter principle of counting and sizing of red cells was used for RBC histogram.
During passage of cells through an aperture there was change in conductance.10
The change in conductance results in an electrical pulse, the amplitude of which is proportional to the cell volume.11, 12
The y axis represents the number of cells per channel, while X axis represents its size, data is further processed by the computer, and the RBC Curve is smoothed by a moving average technique and displayed on a data management system.
Sometimes WBCs are also presented in RBC channel and counted with red blood cells.
If WBCs count was more than 50000 cells, RBC histogram might be affected
The presence of right sided shoulder usually corresponds to reticulocytosis and a flagging of erythrocyte population on the far right of the histogram correlates to red cell agglutination.
In our study we found predominantly hypochromic microcytic anemia in 114 cases (64.77%), followed by Normochromic normocytic anemia in 34 patients (19.31%). Macrocytic anemia was seen in 5 patients (2.84%), Dimorphic anemia in 21 patients (11.93%).
Pancytopenia seen in 2 (1.13%) of the cases.
Sandhya et al. (2014), Chavda et al. (2015) and BynaSyam Sundara Rao et al (2017) in their studies also found similar distribution of anemia cases (Table 5).
In our study broad base was observed in 68 patients, left shift was seen in 52 patients, normal curve in 28 patients followed by right shift in 09 patients, while short peak was noted in 07 patients
Sandhya et al (2014),4 Chavda et al (2015)5 and Byna Syam Sundara Rao et al (2017) in their studies also found similar distribution (Table 6).
RBC indices were normal in normochromic normocytic anemia.
High RDW was seen when there was marked anisocytosis.
In our study out of 34(19.31%) cases of normocytic normochromic anemia, 21(11.93%) showed normal curve and 13(7.38)% cases showed broad base curve. These finding were correlated with study carried by Chavda J. and Bynasyam Sundara Rao et al.
MCV and MCH were decreased in microcytic hypochromic anemia but MCHC was normal. RBC with low MCV had shown shift to left.12, 13
High RDW and broad base curve was due to anisocytosis.
In hypochromic microcytic anemia as there was micocytosis and RDW was increased.
On peripheral smear also, hypochromic microcytic anemia showed anisopoikilocytosis.
Out of 114 (64.77%) cases of microcytic hypochromic anemia, 04(2.27%) cases were normal, 59 (33.52%) cases had left shift curve, 44 (25%) cases showed broad base curve, 04 (2.27%) cases showed bimodal curve histogram and 03 (1.70%) cases showed short peak.
These finding were correlated with study carried out by Sandhya4 and Chavda J.5
The short peak were well correlated with low haemoglobin and red cell count.
In Dimorphic anemia the histogram may have 2 or more red cell populations, whereas in dual populations, the histogram had 2 distinct red cell populations.
In dimorphic blood picture there may be dual population of microcytic & normocytic or normocytic & macrocytic red cells or admixture of small, normal and large cells of different sizes or admixture of patient and donor red cells.
In our study in dimorphic anemia, a MCV, MCH and MCHC were normal and increased RDW due to marked ansiopoikilocytosis was noted.
The dimorphic RBC showing bimodal curve along with some cases showing left and right shifting of curve.
Dimorphic population of cells was seen in nutrional anemia, recent blood transfusion or response therapy to nutrional anemia.5, 6, 7
Out of total 21 (11.93%) cases of dimorphic anemia, 02 (1.13)% cases showed normal curve, 01(0.56%) cases showed left curve, 07(3.97%) cases showed right curve, 02(1.13%) cases showed broad base curve and 09 (5.11%) cases showed bimodal curve. These finding were correlated with study carried out by Sandhya4 and Chavda J.5
In macrocytic anemia right shift with broad based curve means low Hb and macrocytic blood picture.
Macrocytosis could be seen in many conditions so proper approach was required for diagnosis. 5, 6 Macrocytosis might occur at any age, but it was more prevalent in old age.10, 12, 13
Increased MCV, RDW, MCH with normal MCHC was seen in macrocytic anemia.
All 5 (2.84%) cases of macrocytic anemia showed right shift curve. This finding was correlated with Sandhya et al.4
Increased MCV and MCH were correlated with right shift curve.
Borad base curve was seen in all pancytopenia cases which correlated with study of Sandhya et al.4
When used with RBC indices, histogram was very useful in typing of anemia.
Conclusion
Histogram plays an additional role with peripheral smear for diagnosing RBCs disorders. Haematology analyzers were very useful and reliable for evaluation of abnormal peripheral smears. Histogram was correlated with almost all peripherial smear interpretation in anemia cases (p value <0.001, chi square value 70.14). Majority of the cases show good correlation between PS findings and histogram but histogram could be used only as a screening tool and not a diagnostic one.

